
Telemetry
Throttle and brake as live graphs
What it is for
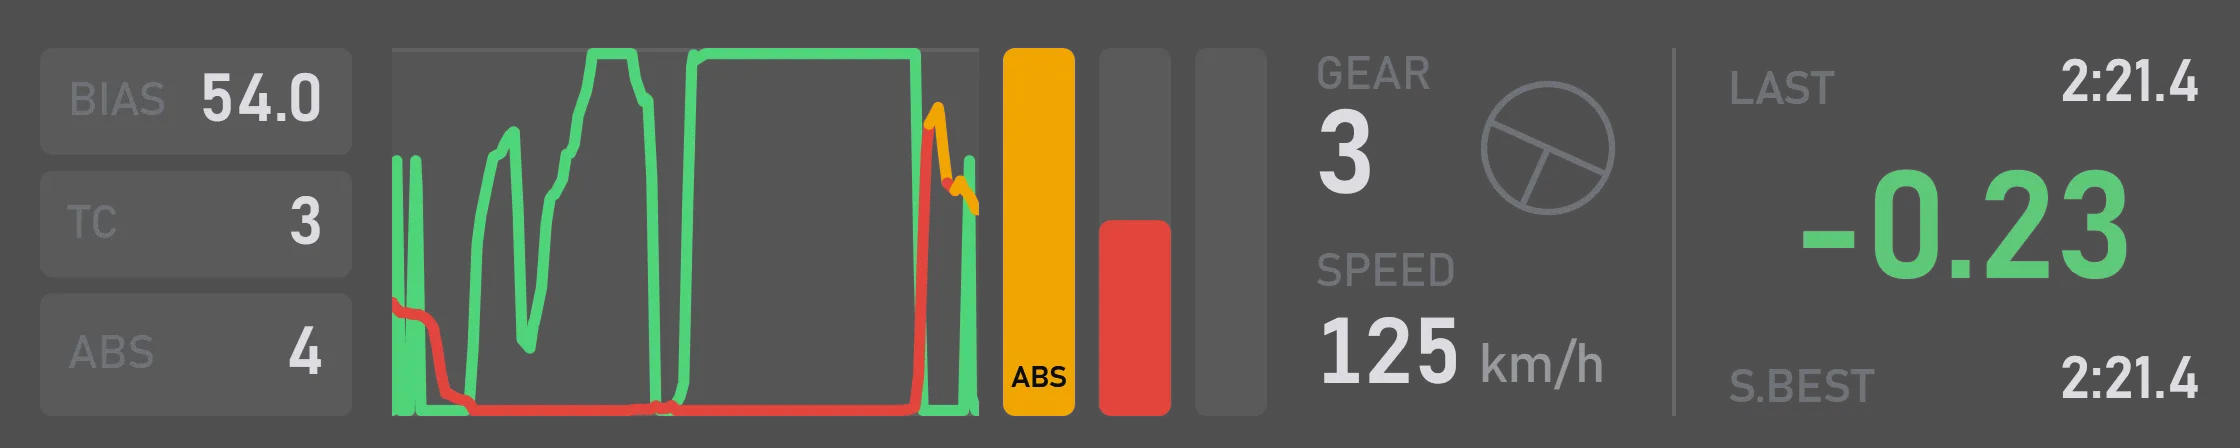
The graph shows throttle and brake over the last few seconds: you see the shape of every braking zone and every corner exit, not just a single number in the moment.
The brake line turns amber where ABS worked. Beside the graph sit the readings that go with the pedals: brake bias, TC and ABS, gear and speed, wheel angle and the delta.
What you can tune
How many seconds the graph shows: a few for one corner, more for a whole sequence.
An amber brake line where ABS worked, and an indicator that lights up while ABS is working. Either can be switched off.
Brake bias, TC and ABS; gear and speed; wheel angle; the delta. Each one switches on separately.
Size, position and when it shows are set the same way for every widget.
Where you change it
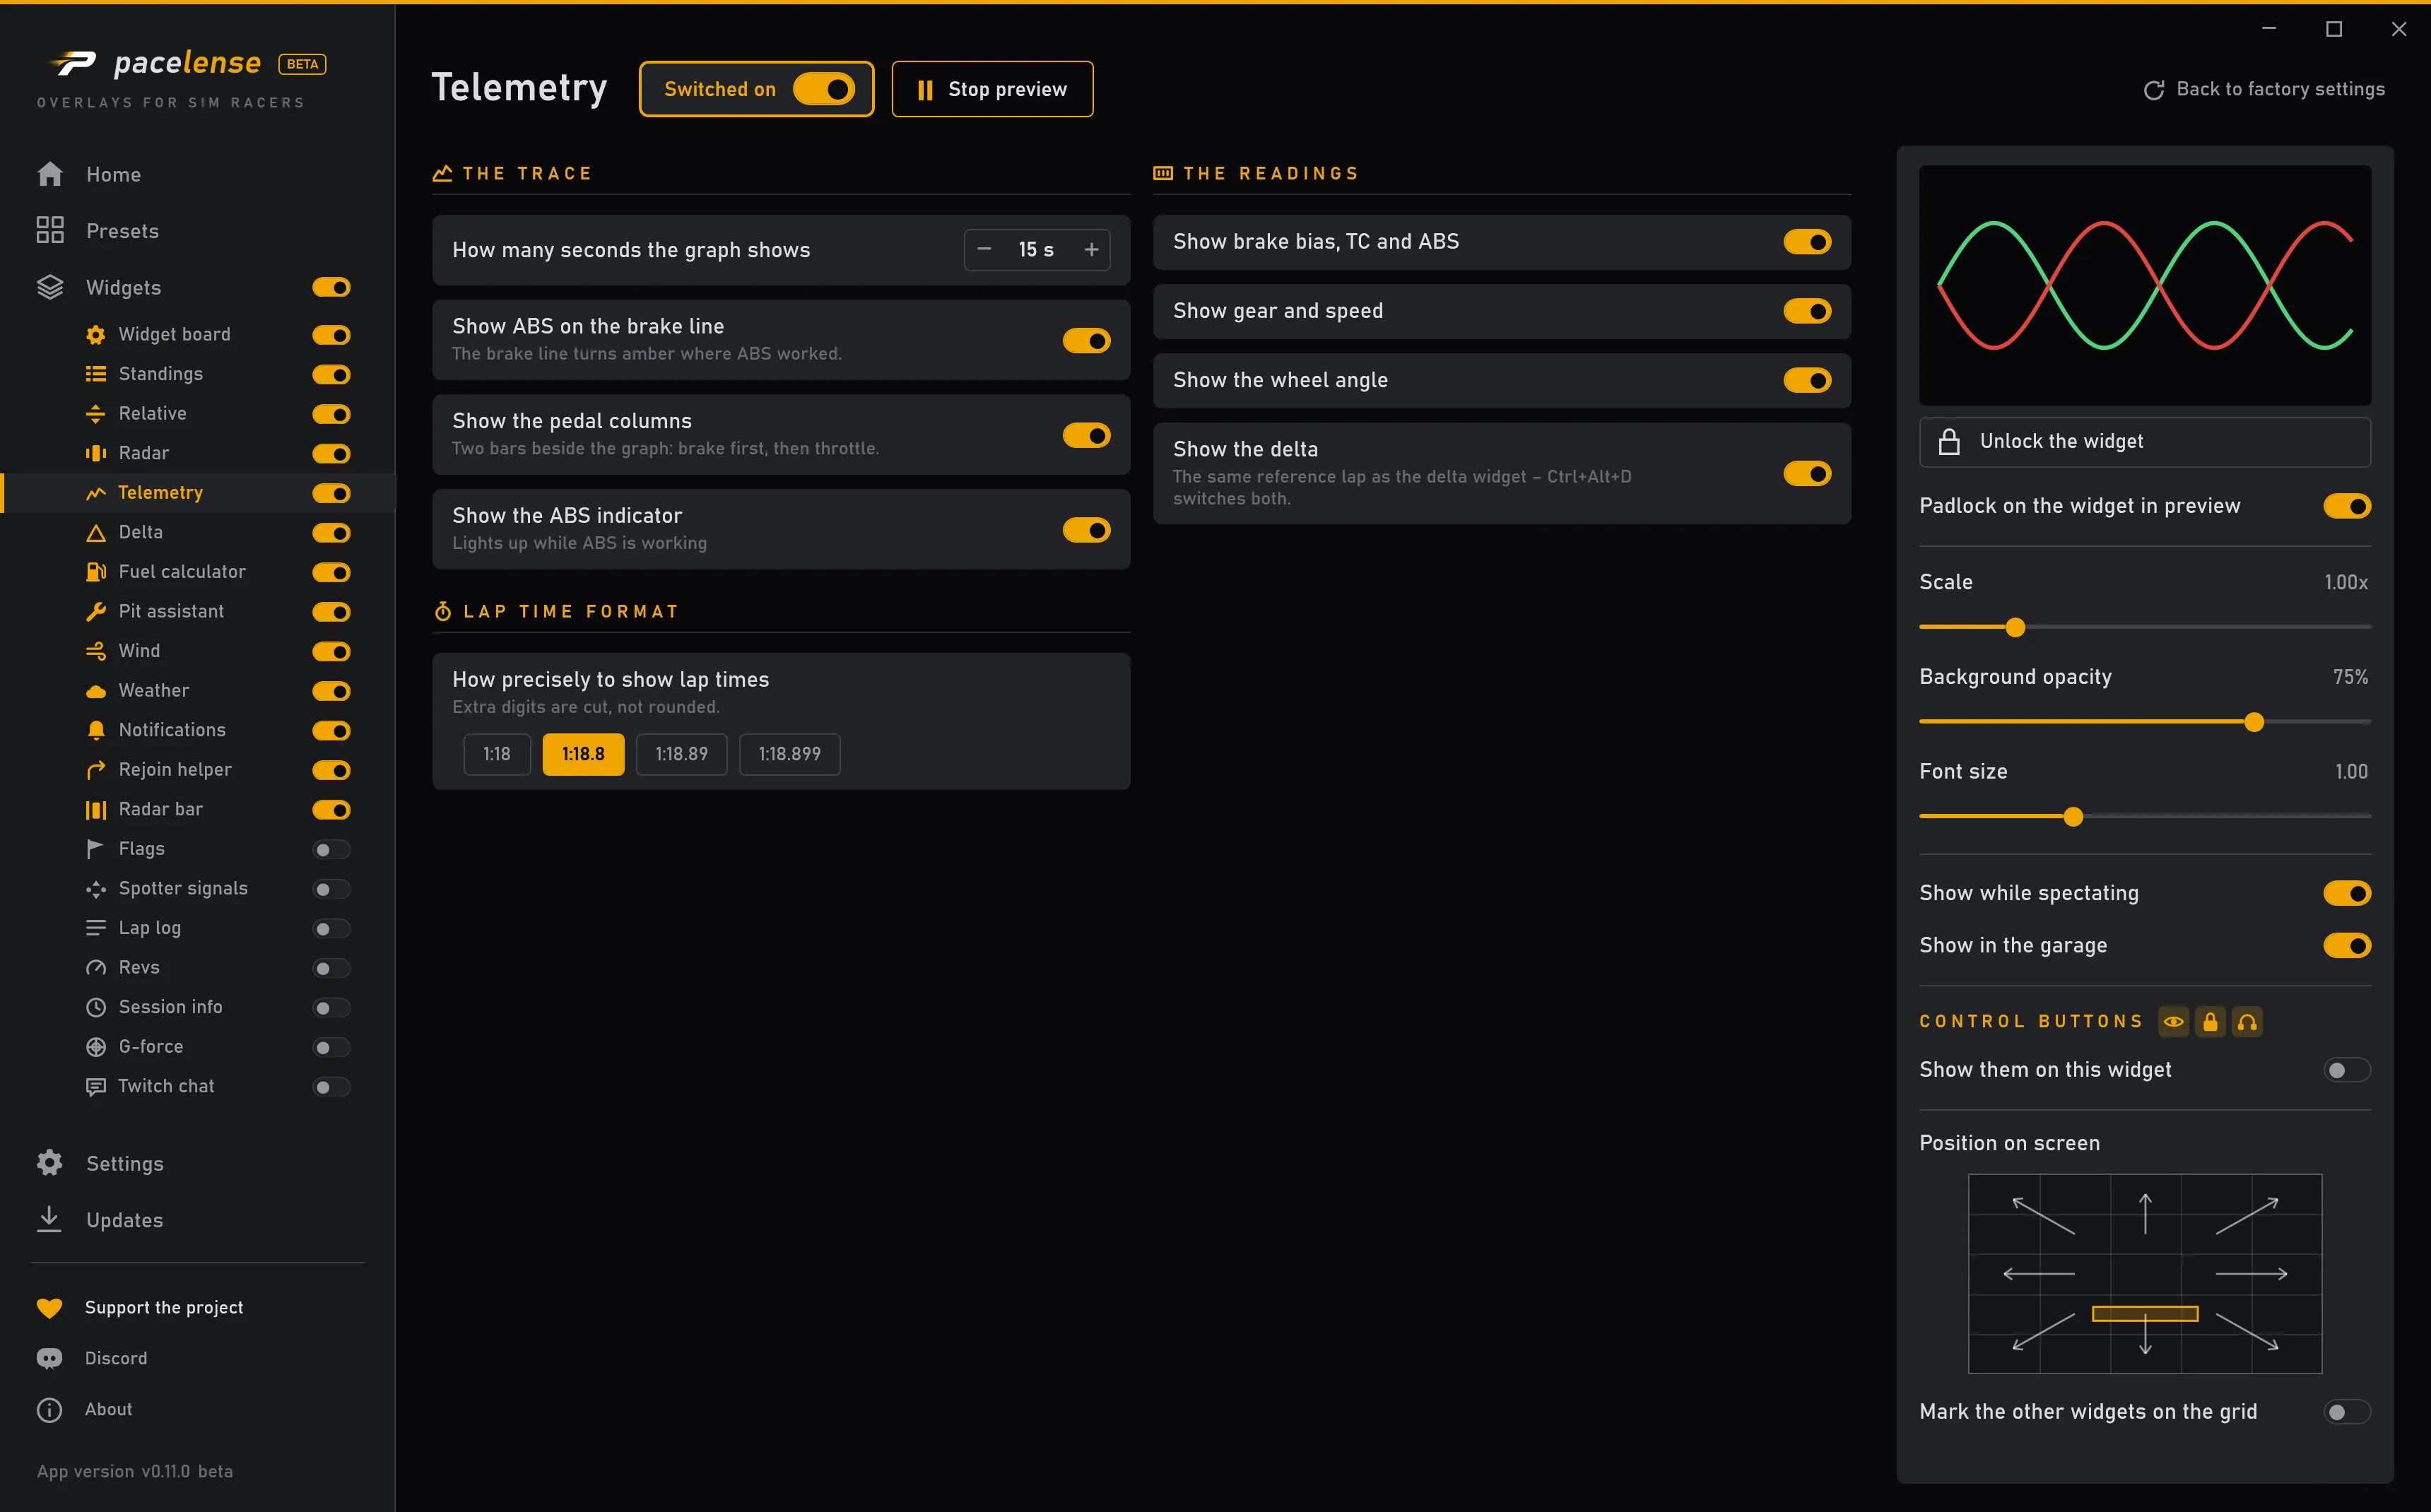
Each change takes effect at once — there is no apply button.